


Censuses have been conducted in Belize (formerly the British Settlement of Belize in the Bay of Honduras and then British Honduras) for over 230 years. Over this time the enumerated population grew from 2,493 persons in 1790 to 397,483 persons in 2022. Initially, censuses were simple head counts of the population centered around the Belize District. Still, over time this changed dramatically to the current situation in which the entire country is enumerated, and the census serves as a valuable tool to collect information on the country’s structure and main socioeconomic and cultural characteristics. This information is used to address issues of poverty, education, health, and the economy. A brief overview of the history of censuses in Belize is provided in the sequel.
A Historical Recollection - Belize Population Censuses
1816 – 2022
Introduction

Census History Timeline
-

The first recorded census in Belize was held on October 22nd, 1790 with a total recorded population of 2,493 persons, classified by sex, race, and age (Table 1).
Table 1
Population Count, October 22nd, 1790Description of inhabitants Male Female Children Total Free persons 109 123 108 340 Slaves 1,025 496 402 1,923 White persons 156 37 37 230 Total 1,290 656 547 2,493 -
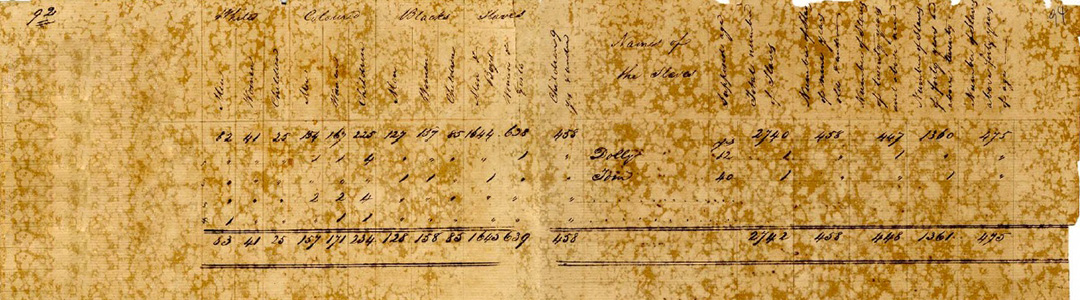
The country’s second census held in December 1816 was conducted for the British Settlement of Belize in the Bay of Honduras. The population count of 3,824 persons was disaggregated by sex, race, and age (Table 2).
Table 2
Population Count, December, 1816Description of inhabitants Male Female Children Total White persons 83 41 25 149 Coloured persons 157 71 34 562 Black free persons 128 158 85 371 Slaves 1,645 639 458 2,742 Total 2,013 1,009 802 3,824 -
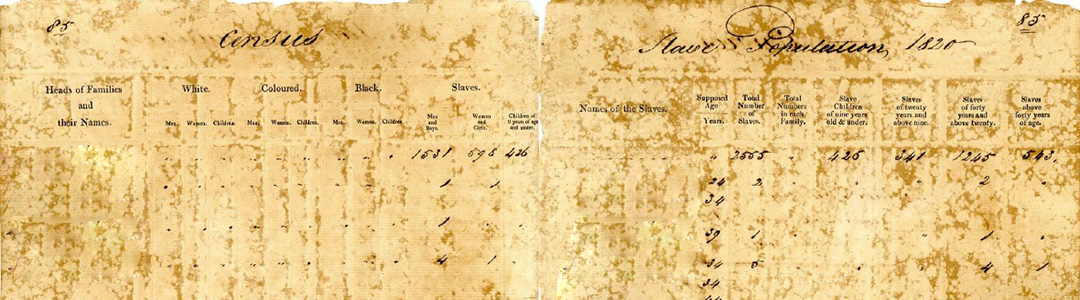
On December 31, 1820 a Census of the Slave Population of the British Settlement of Belize in the Bay of Honduras was conducted. There was a decrease of 179 (6.53%) slaves compared to December 1816. The total number of adult male and female slaves recorded was 1,537 and 600, respectively (a total of 2,137 slaves) (see Table 3). The count of children was not disaggregated into males and females. It should be noted that during this period individuals were considered children only if they were less than 9 years old.
Table 3
Slave population, December, 1820Description of inhabitants Male Female Children younger than 9 years Total Slaves 1,537 600 426 2,563 Total 1,537 600 426 2,563 -
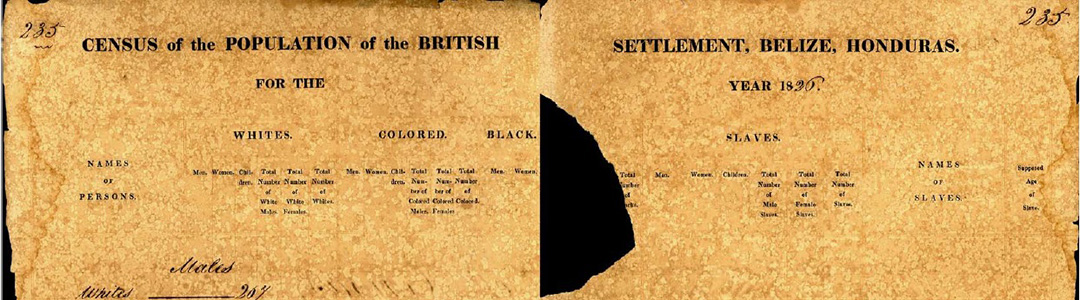
After 1820 and up until 1835, the population census was conducted every 3 years. During this time, the process involved the completion of returns, which were handed in at the Records Office. This method of counting the population proved not satisfactory to the Keeper of Records because many free persons did not participate. Population counts for the five censuses conducted during this time period can be seen in Table 4.
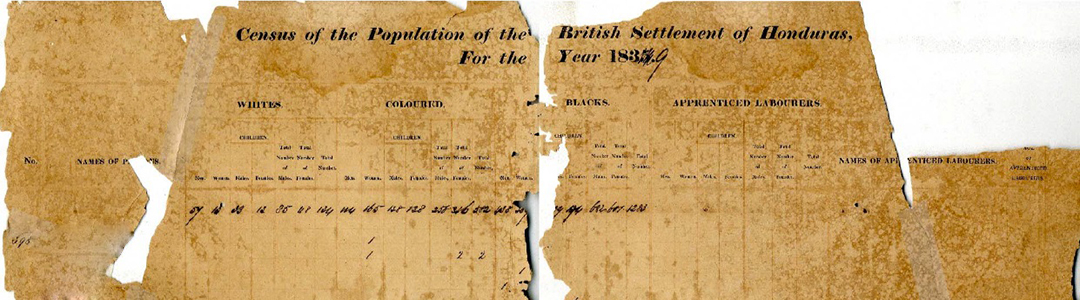
It is interesting to note that, while slavery was abolished in 1834, the persons enumerated in 1835 were still classified as Freemen and Slaves. This classification of ‘Slaves’ was corrected in 1901 and replaced with ‘Apprenticed Labourers’.Table 4
Population of free persons, slaves and troops
Census 1923-1835Free persons Slaves Total Year Male Female Total Male Female Total Troops Male Female Total 1823 841 798 1,639 1,654 814 2,468 2,495 1,612 4,107 1826 1,896 891 2,787 1,606 804 2,410 456 3,958 1,695 5,653 1829 937 919 1,856 1,347 680 2,027 352 2,636 1,599 4,235 1832 1,467 1,036 2,503 1,132 651 1,783 251 2,850 1,687 4,537 1835 654 705 1,359 768 416 1,184 1,422 1,121 2,543 -
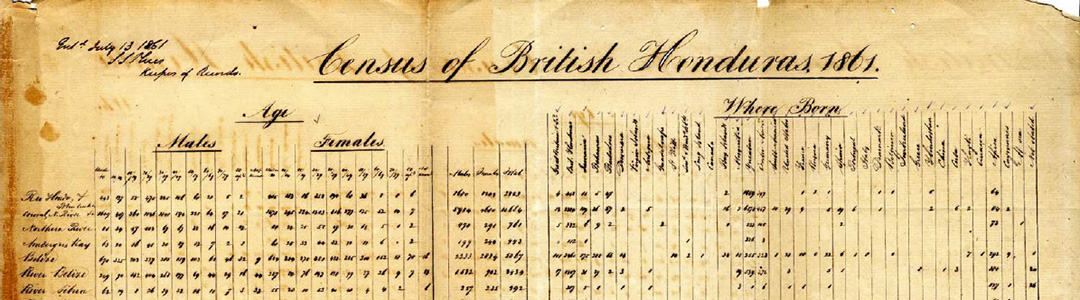
There are no census records between the years of 1836 and 1860 because, as recorded in the ‘Blue Book of 1855’, no Census had been taken for years. An approximation in 1855, estimated the population at 15,000 persons. In the ‘West Indian Census, 1946’ document it was observed that the censuses conducted up to 1835 were concentrated around the Belize District and there is no mention of the population of the Northern, Western and Southern parts of the Settlement. Therefore, the increase between 1835 and 1861 (see Table 5) is attributed to the inclusion and the increase of the population in other parts of the Settlement. The Northern Districts expanded due to the immigration from Mexico caused by the Caste War, while the population of the Stann Creek and Toledo Districts increased with migrants from Honduras and Guatemala.
Table 5
Population by sex
Census 1816-2010Year Male Female Total Rate of increase 1816 3,824 1823 2,495 1,612 4,107 7.4% 1826 3,958 1,695 5,653 37.6% 1829 2,636 1,599 4,235 -25.1% 1832 2,850 1,687 4,537 7.1% 1835 1,422 1,121 2,543 -43.9% 1861 13,789 11,846 25,635 908.1% 1871 12,603 12,107 24,710 -3.6% 1881 14,108 13,344 27,452 11.1% 1891 16,268 15,203 31,471 14.6% 1901 19,140 18,339 37,479 19.1% 1911 20,374 20,084 40,458 7.9% 1921 22,564 22,753 45,317 12.0% 1931 25,524 25,823 51,347 13.3% 1946 28722 30498 59220 15.3% 1960 44,659 45,846 90,505 52.8% 1970 60,091 59,843 119,934 32.5% 1980 73,617 71,736 145,353 21.2% 1991 96,325 93,068 189,393 30.3% 2000 125,065 123,851 248,916 31.4% 2010 161,220 161,221 322,441 29.5% -
After 1861 and up to April 1931, a Census was conducted every 10 years. While there was always careful supervision, enumerators frequently reported difficulties in reaching households (Report of the Census of British Honduras, 1911). Another problem that has posed a challenge to enumerators even up to more recent censuses is the disinclination of individuals to be enumerated. However, the report states that a little tact on the part of the enumerators went a long way in helping them to obtain all the information required, a fact which is as true of modern day censuses as it was then.
The Censuses of April 1891 and March 1901 were much more detailed with regards to the information collected. This included the topics of sex, age, address, literacy (can read, can write name), type of household, dwelling and type of union.Table 5
Population by sex
Census 1816-2010Year Male Female Total Rate of increase 1816 3,824 1823 2,495 1,612 4,107 7.4% 1826 3,958 1,695 5,653 37.6% 1829 2,636 1,599 4,235 -25.1% 1832 2,850 1,687 4,537 7.1% 1835 1,422 1,121 2,543 -43.9% 1861 13,789 11,846 25,635 908.1% 1871 12,603 12,107 24,710 -3.6% 1881 14,108 13,344 27,452 11.1% 1891 16,268 15,203 31,471 14.6% 1901 19,140 18,339 37,479 19.1% 1911 20,374 20,084 40,458 7.9% 1921 22,564 22,753 45,317 12.0% 1931 25,524 25,823 51,347 13.3% 1946 28722 30498 59220 15.3% 1960 44,659 45,846 90,505 52.8% 1970 60,091 59,843 119,934 32.5% 1980 73,617 71,736 145,353 21.2% 1991 96,325 93,068 189,393 30.3% 2000 125,065 123,851 248,916 31.4% 2010 161,220 161,221 322,441 29.5% -

In 1901, 33.67% of the population could read while 28.63% could have only written their names. This was a slight increase of 2.03% and 0.97% respectively, when compared to April 1891.
It was on the night of April 02, 1911 that the first Houses and Population Census was conducted, which included a count of the inhabited and uninhabited houses, buildings and places not used as dwellings. The districts of Belize (15,118 persons), Corozal (6,093 persons) and Orange Walk (5,897 persons) were the most populated districts, while the Toledo District had the smallest population of 4,214 persons.
-
In November 1931, the Colony of British Honduras was instructed to discontinue work on the census and to dismiss temporary clerks. This was due to financial deficiency resulting from the aftermath of the devastating hurricane, the Belize Hurricane, which struck the Colony on the 10th September 1931 with category 4 winds that killed an estimated 2,500 inhabitants. The census, which was conducted in April, had not been fully tabulated by the end of November when the census clerks were terminated from their posts. Therefore, the abstracts for this census are not as detailed as they should have been. Nevertheless, past records show that the population now stood at 51,347 (see Table 5). Conduct of the Census was resumed 15 years later in 1946.
Table 5
Population by sex
Census 1816-2010Year Male Female Total Rate of increase 1816 3,824 1823 2,495 1,612 4,107 7.4% 1826 3,958 1,695 5,653 37.6% 1829 2,636 1,599 4,235 -25.1% 1832 2,850 1,687 4,537 7.1% 1835 1,422 1,121 2,543 -43.9% 1861 13,789 11,846 25,635 908.1% 1871 12,603 12,107 24,710 -3.6% 1881 14,108 13,344 27,452 11.1% 1891 16,268 15,203 31,471 14.6% 1901 19,140 18,339 37,479 19.1% 1911 20,374 20,084 40,458 7.9% 1921 22,564 22,753 45,317 12.0% 1931 25,524 25,823 51,347 13.3% 1946 28722 30498 59220 15.3% 1960 44,659 45,846 90,505 52.8% 1970 60,091 59,843 119,934 32.5% 1980 73,617 71,736 145,353 21.2% 1991 96,325 93,068 189,393 30.3% 2000 125,065 123,851 248,916 31.4% 2010 161,220 161,221 322,441 29.5% -
The census in 1931 cost $4,482 which was a considerable decrease of almost 42.0% when compared to the census budget of $7,720 in 1921.
-

In 1960, census officials started using the media to inform the public of the census. According to newspaper advertisements, this census started at 6:00 pm and ended at midnight. A total of 160 enumerators were hired to collect the data. Those who were not counted by morning were asked to contact the Census Officer immediately. The public was urged to refrain from public gatherings and the head of each family was required to stay up until midnight after Census Night ended.
Table 5
Population by sex
Census 1816-2010Year Male Female Total Rate of increase 1816 3,824 1823 2,495 1,612 4,107 7.4% 1826 3,958 1,695 5,653 37.6% 1829 2,636 1,599 4,235 -25.1% 1832 2,850 1,687 4,537 7.1% 1835 1,422 1,121 2,543 -43.9% 1861 13,789 11,846 25,635 908.1% 1871 12,603 12,107 24,710 -3.6% 1881 14,108 13,344 27,452 11.1% 1891 16,268 15,203 31,471 14.6% 1901 19,140 18,339 37,479 19.1% 1911 20,374 20,084 40,458 7.9% 1921 22,564 22,753 45,317 12.0% 1931 25,524 25,823 51,347 13.3% 1946 28722 30498 59220 15.3% 1960 44,659 45,846 90,505 52.8% 1970 60,091 59,843 119,934 32.5% 1980 73,617 71,736 145,353 21.2% 1991 96,325 93,068 189,393 30.3% 2000 125,065 123,851 248,916 31.4% 2010 161,220 161,221 322,441 29.5% -
Although comprising only a minimal share of the total census budget, public awareness is an instrumental component of this exercise, serving to instill in the general populace the importance of conducting a census, encourage participation by households, promote buy-in from stakeholders, and publicize the findings after data has been processed and analysed.
-

Before 1970, censuses were all conducted in one night. After 1970, however, there was greater financing provided to hire more enumerators and additional time was given to carry out the census. That year was known as the Year of Census for most countries and the information collected was tabulated and provided to the United Nations so that the world population and other indicators could be determined. For the first time in 1970, the census did more than merely count people, since additional questions were included to determine the level of poverty in the country. These vital statistics were later used to create national and regional development programs to raise the economic level of the poor countries and the people.
Table 5
Population by sex
Census 1816-2010Year Male Female Total Rate of increase 1816 3,824 1823 2,495 1,612 4,107 7.4% 1826 3,958 1,695 5,653 37.6% 1829 2,636 1,599 4,235 -25.1% 1832 2,850 1,687 4,537 7.1% 1835 1,422 1,121 2,543 -43.9% 1861 13,789 11,846 25,635 908.1% 1871 12,603 12,107 24,710 -3.6% 1881 14,108 13,344 27,452 11.1% 1891 16,268 15,203 31,471 14.6% 1901 19,140 18,339 37,479 19.1% 1911 20,374 20,084 40,458 7.9% 1921 22,564 22,753 45,317 12.0% 1931 25,524 25,823 51,347 13.3% 1946 28722 30498 59220 15.3% 1960 44,659 45,846 90,505 52.8% 1970 60,091 59,843 119,934 32.5% 1980 73,617 71,736 145,353 21.2% 1991 96,325 93,068 189,393 30.3% 2000 125,065 123,851 248,916 31.4% 2010 161,220 161,221 322,441 29.5% -

In 1980, there was a total of 300 enumerators conducting the census, which ran from April 14th to May 12th. The census questionnaire for that year addressed 9 sections: area in which a person lived, characteristics of the person, migration, education, economic activity, fertility, housing characteristics and languages spoken. Media advertisements urged cooperation from the citizens and stressed the confidentiality of personal data. It also sought to encourage citizens’ participation by advising them that the information would be used by the government and businesses to develop projects that would benefit the people.
Table 5
Population by sex
Census 1816-2010Year Male Female Total Rate of increase 1816 3,824 1823 2,495 1,612 4,107 7.4% 1826 3,958 1,695 5,653 37.6% 1829 2,636 1,599 4,235 -25.1% 1832 2,850 1,687 4,537 7.1% 1835 1,422 1,121 2,543 -43.9% 1861 13,789 11,846 25,635 908.1% 1871 12,603 12,107 24,710 -3.6% 1881 14,108 13,344 27,452 11.1% 1891 16,268 15,203 31,471 14.6% 1901 19,140 18,339 37,479 19.1% 1911 20,374 20,084 40,458 7.9% 1921 22,564 22,753 45,317 12.0% 1931 25,524 25,823 51,347 13.3% 1946 28722 30498 59220 15.3% 1960 44,659 45,846 90,505 52.8% 1970 60,091 59,843 119,934 32.5% 1980 73,617 71,736 145,353 21.2% 1991 96,325 93,068 189,393 30.3% 2000 125,065 123,851 248,916 31.4% 2010 161,220 161,221 322,441 29.5% -

In 1991, May 12th was designated as Census Day. While 6:00 p.m. on this date marks the official start of the census, only the homeless population and persons living in institutions are counted on that night. The actual enumeration of persons and households commences the following day. The population count for the 1991-2022 census can be seen in Table 5.
Table 5
Population by sex
Census 1816-2022Year Male Female Total Rate of increase 1816 3,824 1823 2,495 1,612 4,107 7.4% 1826 3,958 1,695 5,653 37.6% 1829 2,636 1,599 4,235 -25.1% 1832 2,850 1,687 4,537 7.1% 1835 1,422 1,121 2,543 -43.9% 1861 13,789 11,846 25,635 908.1% 1871 12,603 12,107 24,710 -3.6% 1881 14,108 13,344 27,452 11.1% 1891 16,268 15,203 31,471 14.6% 1901 19,140 18,339 37,479 19.1% 1911 20,374 20,084 40,458 7.9% 1921 22,564 22,753 45,317 12.0% 1931 25,524 25,823 51,347 13.3% 1946 28722 30498 59220 15.3% 1960 44,659 45,846 90,505 52.8% 1970 60,091 59,843 119,934 32.5% 1980 73,617 71,736 145,353 21.2% 1991 96,325 93,068 189,393 30.3% 2000 125,065 123,851 248,916 31.4% 2010 161,207 161,204 322,424 29.5% 2022 195,695 201,789 397,483 23.3% -
Summary of Recorded Census
- First recorded population census: 1790
- Second recorded population census: 1816
- Every 3 years: 1820 to 1835
- No census for 26 years, until 1861
- At irregular intervals: 1861 to 1960
- Since 1960: Every 10 years, except in 1991