
Sample Design
- Belize MICS5 employed a two–stage sample design with stratification, using systematic random sampling.
- In designing the sample, consideration was given to the distribution of the Census 2010 population by district, area of residence and sex, as well as to the following indicators for each domain of estimation:
- Number of households
- Average Number of Children Ages 0-4 per Household
- Average Number of Men Ages 15-49 per Household
- Average Number of Females Ages 15-49 per Household
- Average Number of Persons per Household
- Percentage of Households with children ages 0-4 years
- Percentage of Households with females ages 15 to 49
- Percentage of Households with males ages 15 to 49
- During the second stage of the sample selection, a half of the households selected in each cluster will be those with at least one child under 5 years, while the other half will be selected from households with no children under 5 years.
Sample Size
The MICS Sample Size Calculation Template was employed, using the indicator “stunting prevalence”. The results are shown in the Table 1 below:
Belize MICS5 Sample Size Calculation Based on Stunting
Prevalence at MICS4
| Stratum | Prevalence | CV % | DEFF | Sample Size Required |
|---|---|---|---|---|
| Corozal | 0.1967 | 16.3 | 1.915 | 2,236 |
| Orange Walk | 0.1725 | 14.2 | 1.233 | 1,691 |
| Belize City (Southside) | 0.1392 | 22.1 | 0.923 | 1,632 |
| Belize Other | 0.1069 | 15.5 | 1.009 | 2,411 |
| Cayo | 0.1857 | 14.2 | 1.245 | 1,561 |
| Stann Creek | 0.1748 | 15.5 | 1.232 | 1,663 |
| Toledo | 0.4160 | 6.3 | 1.276 | 1,338 |
| Rural | 0.2143 | 6.3 | 1.276 | 1,338 |
| Urban | 01572 | 10.3 | 1.218 | 1,867 |
| National | 0.1930 | 5.3 | 1.219 | 11,623 |
However, due to financial and logistical constraints, the sample was maintained at 5,232 households, as opposed to the 11,623 required to satisfy the conditions shown in Table 1 above. Usually, the allocation to different domains of estimation is done proportionally to the size of the domain. However, in order to obtain more or less similar sampling errors in all domains, the distribution and allocation of the EAs to each domain was determined as shown below in Table 2.
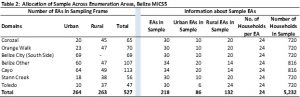
As indicated in Table 2 above, in the first stage of the sample, 218 Enumeration Areas/Clusters have been selected for inclusion in the Belize MICS5, with an 86/132 urban/rural distribution. In the second stage, 24 households will be selected from each of the clusters.
Based on the indicators examined above, it is expected that the sample population will be comprised as follows:
- Minimum of 1,590 children in the 0 to 4 years age group
- Minimum of 5,158 women in the 15 to 49 years age group
- Minimum of 3,207 men in the 15 to 49 years age group
Weighting
Sample weights were calculated for each of the data files. Sample weights for the household data were computed as the inverse of the probability of selection of the household, computed at the sampling domain level (urban/rural within each region). The household weights were adjusted for nonresponse at the domain level and were then normalized by a constant factor so that the total weighted number of households equals the total unweighted number of households. The household weight variable is called HHWEIGHT and is used with the HH data and the HL data.
Sample weights for the women’s data used the un-normalized household weights, adjusted for non-response for the women’s questionnaire, and were then normalized by a constant factor so that the total weighted number of women’s cases equals the total unweighted number of women’s cases.
Sample weights for the men’s data followed the same approach as the women’s and used the un-normalized household weights, adjusted for non-response for the men’s questionnaire, and were then normalized by a constant factor so that the total weighted number of men’s cases equals the total unweighted number of men’s cases.
Sample weights for the children’s data followed the same approach as the women’s and used the un-normalized household weights, adjusted for non-response for the children’s questionnaire, and were then normalized by a constant factor so that the total weighted number of children’s cases equals the total unweighted number of children’s cases.
Data Collection
Data Collection Dates start 14 September 2015 end 20 December 2015
Data Collection Mode Face-to-face [f2f]
Data Collection Notes
- A pre-test fieldexercise for the Belize Multiple Indicator Cluster Survey (MICS5) was conducted on 27th March 2015 to 30 March 2015 in the rural Cayo District and in Belmopan City. The village of Teakettle (Ontario Area) was selected as the rural test-site, while two enumeration districts (EDs) (part of the Las Flores Area and part of the San Martin Area) in the City of Belmopan were selected as the urban test-sites. Personnel from the Statistical Institute of Belize (SIB) were responsible for conducting the pre–test and an observer from UNICEF Belize accompanied the team on the first day.
Training for the pre-test was conducted over a nine-day period, from March 16th to 26th, and was held in the conference room at the SIB headquarters. Sessions began at 8:30a.m. each day and ended at 4:30p.m., except for Friday, March 20th, when training ended at 2:30p.m. to facilitate trainees travelling long distances home. Lunch was for one hour from 12 noon to 1:00p.m., and there was a 15-minute morning and afternoon break.
A round table approach was employed, where trainees were asked to read from the Interviewers’ Manual, making immediate reference to the actual questionnaires. Care was taken to ensure that questions were delivered in a clear and confident manner, and that, if the need arose, trainees would be able to explain to the respondent why a particular question is important.
Training included plenary sessions, intensive smaller group meetings, practice sessions, one day collecting real data in the field and a final summary of the entire process. Special attention was given to editors and field supervisors. Along with the training received by all participants, these persons received special instruction on handling questionnaires, editing questionnaires and field supervision.
The salt test kits and the scales did not arrive in country in time for the PAPI field test. As such, it must be ensured that the salt test kits and scales are thoroughly tested during the CAPI field test. (Scales from the previous round of MICS were utilized during this field test.)
2. Field checkingis designed to identify any problems in the fieldwork as quickly as possible to allow correction by SIB These tables are produced from data entered by the data entry persons. Since the field tables programs were not ready to be implemented it was necessary to produce counts of selected variables from which indicators were calculated to monitor the progress of the fieldwork.
3. Sensitization:A sensitization campaign was executed by UNICEF. The efforts include slogans, jingles, banners, fliers countrywide along with t-shirts and TV talk show appearances of SIB and UNICEF personnel. Presentations were made via the following media platforms:
Wake Up Belize, Open Your Eyes, Love FM, Belize Watch, Rise and Shine, St Charles Cable, Wamalali, Tumul kin, Southern Cable, Hamalalie, Power Mix, Sugar City, Belize TV, Fiesta FM
The Mennonite communities in Corozal, Orange Walk, Stann Creek and Toledo Districts were visited by SIB and UNICEF staff in the week to sensitize the leaders of those communities to the benefits of MICS and to pave the way for interviewers to their communities.
Mode of Data Collection
- Based on a sample size of 5,232 households a total of 28 interviewers completing four questionnaires per day required about 48 days to complete the data collection phase of the survey.
- Each of 7 teams consisted of 4 interviewers, 1 Field Supervisor, 1 Driver, one Field Editor and one Measurer. Each team was assigned an extra interviewer for emergency purposes. Interviewers were females hired from the regions assigned to them.
- Each team had its own vehicle for transporting personnel and equipment.
Data Entry and Data Processing
Data capture using CAPI occurred from 6th July to 29th September, 2015. Cleaning and weighting of the data set occurred from 21st September to 25th October 2015.
Data Collector(s)
Statistical Institute of Belize (SIB), Ministry of Economic Development
Supervision
There were seven data collection teams, one for each region. Each team consisted of
4 interviewers,
1 field editor,
1 field supervisor
1 driver
1 relief interviewer
Each team was supplied with a vehicle for transport, measuring scales, measuring tape, and sundry items including baby wipes and diapers. Teams were expected to follow a predetermined schedule and each member of the team had very specific duties.
1. Interviewers:
i. Administer the questionnaires in the manner prescribed in training.
ii. Perform checks on completed questionnaires before leaving the household
2. Field Editors:
i. Perform a 100% edit of all households from all interviewers
ii Re-interview selected households
iii. Assist interviewers in Anthropometry
iv. Place completed households on order for transport to the district office
3. Field Supervisor
i. Assist in locating households
ii. Perform Anthropometry
iii. Assist interviewers whenever required.
Response Rates
The urban response rate 92.7 percent is lower than the total 96.4 and rural response rate 96.4 percent.
| Corozal | 97.5 percent |
| Toledo | 97.3 percent |
| Cayo | 95.9 percent |
| Stann Creek | 94.6 percent |
| Orange Walk | 93.9 percent |
| Belize city Southside | 92.8 percent |
| Belize (Exc Belize City Southside | 90.5 percent |
Estimates of Sampling Error
The sample of respondents selected in the Belize Multiple Indicator Cluster Survey is only one of the samples that could have been selected from the same population, using the same design and size. Each of these samples would yield results that differ somewhat from the results of the actual sample selected. Sampling errors are a measure of the variability between the estimates from all possible samples. The extent of variability is not known exactly, but can be estimated statistically from the survey data.
The following sampling error measures were presented for each of the selected indicators:
Standard error (se): Sampling errors are usually measured in terms of standard errors for particular indicators (means, proportions etc). Standard error is the square root of the variance of the estimate. The Taylor linearization method is used for the estimation of standard errors.
- Coefficient of variation(se/r) is the ratio of the standard error to the value of the indicator, and is a measure of the relative sampling error.
- Design effect(deff) is the ratio of the actual variance of an indicator, under the sampling method used in the survey, to the variance calculated under the assumption of simple random sampling. The square root of the design effect (deft) is used to show the efficiency of the sample design in relation to the precision. A deft value of 1.0 indicates that the sample design is as efficient as a simple random sample, while a deft value above 1.0 indicates the increase in the standard error due to the use of a more complex sample design.
- Confidence limitsare calculated to show the interval within which the true value for the population can be reasonably assumed to fall, with a specified level of confidence. For any given statistic calculated from the survey, the value of that statistic will fall within a range of plus or minus two times the standard error (r + 2.se or r – 2.se) of the statistic in 95 percent of all possible samples of identical size and design.
For the calculation of sampling errors from MICS data, SPSS Version 20 Complex Samples module has been used. In addition to the sampling error measures described above, the tables also include weighted and un-weighted counts of denominators for each indicator. Sampling errors are calculated for indicators of primary interest, for the national level, for the regions, and for urban and rural areas. Three of the selected indicators are based on households, 8 are based on household members, 13 are based on women, and 15 are based on children under 5. All indicators presented here are in the form of proportions.