
Sample Design
Introduction
The following guidelines were used in the calculation of sample sizes.
- Estimates are disaggregated to seven regional levels. The regions include the five districts of Corozal, Orange Walk, Cayo, Stann Creek and Toledo. In addition Belize District is partitioned into two regions: Belize City Southside and the remainder of Belize Urban along with Rural Belize District.
- Relative margin of errors at the national level should not exceed 0.12.
- Relative margin of errors at the regional level should be kept as close to 0.20 as practical.
- Sampling using equal allocation at the regional level is implemented.
- Sample sizes are provided using a non-response rate of 10%
- Calculations are performed using the main indicator Vitamin A Supplementation.
Sample sizes assuming a 10% non-response rate
A listing of all households in each of the Enumeration Districts (EDs) selected as primary sampling units was made. EDs are chosen to contain approximately 150 households each. The listing exercise greatly reduce the amount of non-response to the survey and it was estimated that non-response would be less than 10% under these conditions. Accordingly, the relative margins of errors presented below assume the 10% non-response rate.
Relative margin of errors by region and sample sizes (10% non-response rate)
| Sample HH/Region | Belize Southside | Belize | Corozal | Orange Walk | Cayo | Stann Creek | Toledo | Country |
|---|---|---|---|---|---|---|---|---|
| 700 HH/Region | 0.191 | 0.194 | 0.312 | 0.228 | 0.217 | 0.213 | 0.341 | 0.087 |
| 700 HH/Region except 800 in Toledo | 0.191 | 0.194 | 0.312 | 0.228 | 0.217 | 0.213 | 0.319 | 0.086 |
| 800 HH/Region | 0.179 | 0.181 | 0.292 | 0.213 | 0.203 | 0.199 | 0.319 | 0.082 |
Proposed sample selection
- Sample size: 700 households to be chosen from each of the seven Regions as indicated in Table 1.
- Primary sampling unit: 28 EDs from each region
- Total: 4,900 households countrywide.
- Allocation: Equal allocation in each region and PPS to Urban/Rural within regions where appropriate.
- Take: 25 households from each ED.
Sample Sizes Calculation
Sample Size (HH) was calculated using
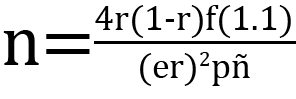
- r = prevalence
- 1.1 = 10% non-response
- f = design effect
- e = relative margin of error
- p = proportion of total proportion on which indicator is based
- ñ = average household size
- 4 = 95% confidence inverval ~=(1.96)^2
Mode of Data Collection
- Based on a sample size of 4,900 households it was estimated that 28 interviewers completing four questionnaires per day would require about 44 days to complete the data collection phase of the survey.
- Each of 7 teams consists of 4 interviewers, 1 Field Supervisor, 1 Driver and one data editor. An assistant editor was made available for two weeks to each region in order to ensure accuracy in the fieldwork at its early stages. Each region also had an extra interviewer for emergency purposes. Interviewers were females hired from the regions assigned to them.
- Each team had its own vehicle for transporting personnel and equipment.
- Recruitment for field staff commenced on 4th April, 2011.
- Based on the results of the field test and a sample size of 4,900 households the total number of questionnaires to be printed was estimated at 4,900 household, 7,900 disability, 6,800 women and 7,500 children under five.
Weighting
Sample weights were calculated for each of the data files. Sample weights for the household data were computed as the inverse of the probability of selection of the household, computed at the sampling domain level (urban/rural within each region). The household weights were adjusted for nonresponse at the domain level and were then normalized by a constant factor so that the total weighted number of households equals the total unweighted number of households. The household weight variable is called HHWEIGHT and is used with the HH data and the HL data. Sample weights for the women’s data used the un-normalized household weights, adjusted for non-response for the women’s questionnaire, and were then normalized by a constant factor so that the total weighted number of women’s cases equals the total unweighted number of women’s cases.
Sample weights for the children’s data followed the same approach as the women’s and used the un-normalized household weights, adjusted for non-response for the children’s questionnaire, and were then normalized by a constant factor so that the total weighted number of children’s cases equals the total unweighted number of children’s cases.
Data Collection
Data Collection Dates start 2011-06-13 end 2011-09-15
Data Collection Mode Face-to-face [f2f]
Data Collection Notes
- A pre-test field exercise for the Belize Multiple Indicator Cluster Survey (MICS4) was conducted on Wednesday 26th January 2011 and Thursday 27th January 2011 in the Orange Walk District in the rural villages of Shipyard, August Pine Ridge and Trinidad and in the urban areas of San Jose Palmar and Orange Walk Town. Personnel from the Statistical Institute of Belize (SIB) were responsible for conducting the pre-test and an observer from UNICEF Belize accompanied the team on the first day.
- Training of Field Workers: Training of 49 Field Workers was conducted over a two week period from 13th to 25th Training sessions were held in Belize City at the University of Belize, Faculty of Management and Social Sciences. Participants were housed in nearby hotels. Training included plenary sessions, intensive smaller group meetings, practice sessions, one day collecting real data in the field and a final summary of the entire process. Special attention was given to editors and field supervisors. Along with the training received by all participants, these persons received special instruction on handling questionnaires, editing questionnaires and field supervision.
- Secondary editing programs were not in place during the data collection phase of the survey.
- Field checking is designed to identify any problems in the fieldwork as quickly as possible to allow correction by SIB staff. These tables are produced from data entered by the data entry persons. Since the field tables programs were not ready to be implemented it was necessary to produce counts of selected variables from which indicators were calculated to monitor the progress of the fieldwork.
- The sensitization campaign started two weeks prior to the fieldwork and lasted throughout the entire fieldwork. The initial two weeks of the campaign made the public aware of the purpose, goals and duration of the proposed MICS survey. This campaign utilized the slogan “Get in the MICS4 improving the lives of our children” which was reproduced on flyers, banners t-shirts, bags, key rings and pens.
Mode of Data Collection
- Based on a sample size of 5,232 households a total of 28 interviewers completing four questionnaires per day required about 48 days to complete the data collection phase of the survey.
- Each of 7 teams consisted of 4 interviewers, 1 Field Supervisor, 1 Driver, one Field Editor and one Measurer. Each team was assigned an extra interviewer for emergency purposes. Interviewers were females hired from the regions assigned to them.
- Each team had its own vehicle for transporting personnel and equipment.
Data Entry and Data Processing
Data entry and data processing was scheduled for 13th June to 19th August, 2011. Preparation of tables and preliminary summaries were scheduled for 29th August to 16th September, 2011.
Software:
- CSPro v.4.0 was used for data entry. The CSPro software was provided to the implementing agency by UNICEF at the MICS IV Data Processing Workshop. The software was also available for downloading from the US Bureau of Census website (registration was required).
- PASW Statistics (formally known as SPSS) was used for analysis. One copy of the software was be provided to the implementing agency by UNICEF HQ.
Hardware
Six computers was used in the capture of data; SIB sourced three of these machines while UNICEF provided the remaining 3 computers.
Personnel
Six data entry clerks and one editor/supervisor were hired to capture and edit the data. SIB had a pool of persons from which these clerks were chosen. A seventh person was hired to provide general supervision and oversight during the entire data processing phase.
Consultant
A data processing consultant was requested from UNICEF to conduct a workshop from 2nd to 13th May, 2011 on data entry screens and programs, the use of the CSPro v.4.0 and SPSS software, data cleaning and determining of weights. Participants included SIB staff and delegates from the participating organizations.
Questionnaires
The questionnaires for the Generic MICS were structured questionnaires based on the MICS3 Model Questionnaire with some modifications and additions.
A household questionnaire was administered in each household, which collected various information on household members including sex, age, relationship, and orphanhood status. The household questionnaire includes household characteristics, support to orphaned and vulnerable children, education, child labour, water and sanitation and child discipline, with an additional module for child disability.
In addition to a household questionnaire, questionnaires were administered in each household for women age 15-49, for children under age five and for children 2 – 11 years. For children, the questionnaire was administered to the mother or caretaker of the child.
The women’s questionnaire includes women’s characteristics, child mortality, tetanus toxoid, maternal and newborn health, marriage, polygyny, contraception, HIV/AIDS knowledge, unmet need, domestic violence, marriage/union, sexual behavior and life satisfaction.
The children’s questionnaire includes children’s characteristics, birth registration and early learning, vitamin A, breastfeeding, care of illness, child development, immunization, and anthropometry.
The questionnaires were developed in English from the MICS3 Model Questionnaires, and were translated into Spanish. After an initial review the questionnaires were translated back into English by an independent translator with no prior knowledge of the survey. The English and Spanish questionnaires were both piloted as part of the survey pretest. All questionnaires and modules are provided as external resources.
Data Collector(s)
Enumeration:
There were seven data collection teams, one for each region. Each team consisted of
4 interviewers,
1 field editor,
1 field supervisor/driver Data Editing.
Each team was supplied with a vehicle for transport, measuring scales, measuring tape, and sundry items including baby wipes and diapers. Teams were expected to follow a predetermined schedule and each member of the team had very specific duties.
- Interviewers:
- Administer the questionnaires in the manner prescribed in training.
- Perform checks on completed questionnaires before leaving the household
- Field Editors:
- Perform a 100% edit of all households from all interviewers
- Re-interview selected households
- Assist interviewers in Anthropometry
- Place completed households on order for transport to the district office
- Field Supervisor/Driver
- Assist in locating households
- Transport personnel and materials
- Perform Anthropometry
- Assist interviewers whenever required.
Data Editing:
Each team was supervised by two officers from SIB.
- An Office Editor
- is stationed in the SIB office for the region and provided 100% editing of each cluster as it came in from the field.
- was also required to visit his/her team twice per week. These visits were designed to ensure that the fieldwork was going according to plan and to ensure that the households selected in the sample were being properly identified and interviewed.
- was responsible for passing the edited clusters to SIB in Belmopan
- SIB Statistician
- Each team was visited once each week by a senior SIB statistician. These officers corrected systematic errors being committed by Team members and Office Editors.
- Resupplied teams with questionnaires and supplies.
Field Checking Tables:
Field checking was designed to identify any problems in the fieldwork as quickly as possible to allow correction by SIB staff. These tables were produced from data entered by the data entry persons. Since the field tables programs were not ready to be implemented it was necessary to produce counts of selected variables from which indicators were calculated to monitor the progress of the fieldwork.
Other Processing
Data were processed in clusters, with each cluster being processed as a complete unit through each stage of data processing. Each cluster goes through the following steps:
1) Questionnaire reception
2) Office editing
3) Manual Data entry
4) Structure and completeness checking
5) Verification entry
6) Comparison of verification data
7) Field Check table production
8) Back up of raw data
9) Correction of questionnaires in the field if necessary
10) Edited data back up
After all clusters are processed, all data is concatenated together and then the following steps are completed for all data files:
11) Export to SPSS in 4 files (hh – household, hl – household members, wm – women, ch – children under 5, da – disability)
12) Recoding of variables needed for analysis
13) Adding of sample weights
14) Calculation of wealth quintiles and merging into data
15) Structural checking of SPSS files
15) Data quality tabulations
16) Production of analysis tabulations
Details of each of these steps can be found in the data processing documentation, data editing guidelines, data processing programs in CSPro and SPSS, and tabulation plan.
Data entry was conducted by 6 data entry operators supervised by 2 data entry supervisors, using a total of 7 computers (6 data entry computers plus one supervisors’ computer). All data entry was conducted at the Statiatical Institute of Belize head office using manual data entry. For data entry, CSPro version 4.0 was used with a highly structured data entry program, using system controlled approach that controlled entry of each variable. All range checks and skips were controlled by the program and operators could not override these. A limited set of consistency checks were also included in the data entry program. Structure and completeness checking ensured that all questionnaires for the cluster had been entered, were structurally sound, and that women’s and children’s questionnaires existed for each eligible woman and child. 100% verification of all variables was performed using independent verification, i.e. double entry of data, with separate comparison of data followed by modification of one or both datasets to correct keying errors by original operators who first keyed the files. A small sample of households were returned to the field for independent data collection and verification. After completion of all processing in CSPro, all individual cluster files were backed up before concatenating data together using the CSPro file concatenate utility.
For tabulation and analysis SPSS version 18.0 was used. After transferring all files to SPSS, certain variables were recoded for use as background characteristics in the tabulation of the data, including grouping age, education, geographic areas as needed for analysis. Additionally, a wealth (asset) index of household members was calculated using principal components analysis, based on household assets, and both the score and quintiles were included in the datasets for use in tabulations.
Estimates of Sampling Error
The sample of respondents selected in the Belize Multiple Indicator Cluster Survey is only one of the samples that could have been selected from the same population, using the same design and size. Each of these samples would yield results that differ somewhat from the results of the actual sample selected. Sampling errors are a measure of the variability between the estimates from all possible samples. The extent of variability is not known exactly, but can be estimated statistically from the survey data.
The following sampling error measures were presented for each of the selected indicators:
- Standard error (se): Sampling errors are usually measured in terms of standard errors for particular indicators (means, proportions etc). Standard error is the square root of the variance of the estimate. The Taylor linearization method is used for the estimation of standard errors.
- Coefficient of variation (se/r) is the ratio of the standard error to the value of the I ndicator, and is a measure of the relative sampling error.
- Design effect (deff) is the ratio of the actual variance of an indicator, under the sampling method used in the survey, to the variance calculated under the assumption of simple random sampling. The square root of the design effect (deft) is used to show the efficiency of the sample design in relation to the precision. A deft value of 1.0 indicates that the sample design is as efficient as a simple random sample, while a deft value above 1.0 indicates the increase in the standard error due to the use of a more complex sample design.
- Confidence limits are calculated to show the interval within which the true value for the population can be reasonably assumed to fall, with a specified level of confidence. For any given statistic calculated from the survey, the value of that statistic will fall within a range of plus or minus two times the standard error (r + 2.se or r – 2.se) of the statistic in 95 percent of all possible samples of identical size and design.
For the calculation of sampling errors from MICS data, SPSS Version 18 Complex Samples module has been used. In addition to the sampling error measures described above, the tables also include weighted and un-weighted counts of denominators for each indicator. Sampling errors are calculated for indicators of primary interest, for the national level, for the regions, and for urban and rural areas. Three of the selected indicators are based on households, 8 are based on household members, 13 are based on women, and 15 are based on children under 5. All indicators presented here are in the form of proportions.